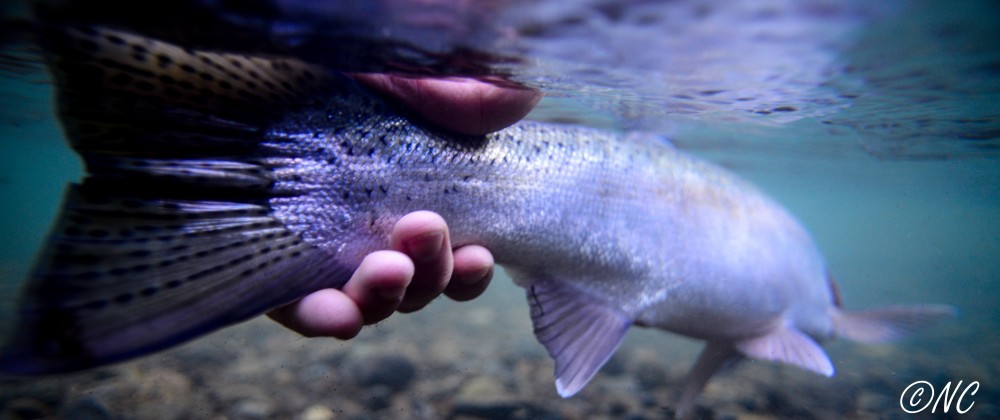
It’s long been recognized and acknowledged that fisheries are inducing change in fish populations. When the largest individuals of a population are removed year after year, as results from commercial fishing, the overall body size and age of maturity of the population decreases. This makes sense: there are fewer large individuals to pass on their genes, and a greater number of smaller fish breed and contribute to the overall population. But the important questions are: (a) how fast is change occurring within these species and (b) what traits are most affected?
To answer these questions, a recent study by Audzijonyte et al. compared modeling studies (which are based on simulations) and experimental studies. More specifically, this study sought to investigate three areas: (1) Are the rates of evolution different between experimental and modeling studies? (2) Are certain traits affected more than others? (3) Do modeling studies differ in their estimated rates of fisheries-induced evolution?
To do this, the authors scanned the literature and came up with 14 modeling studies and an equal number of experimental studies, plus one review of experimental work. To easily compare all studies, they standardized to a common value of percent change in trait value per year. They then grouped traits into five categories; (1) size at maturity, (2) age at maturity, (3) median maturation reaction norm*, (4) growth, and (5) reproductive investment.
*A reaction norm is when, for example, a single species can express different phenotypes (observable traits/characteristics) depending on the environment it lives in. A quick, illustrative example is from the Atlantic silverside. Silversides at lower latitude (warmer temperatures) have fewer vertebrae than silversides from higher latitudes (cold environment). One species differs its phenotype based on the environment (temperature) it lives in.*
What did the results show? For question one, rates of evolution were statistically significant. Modeling studies reported a range from 0.1 to 4% in trait change per year, while experimental studies ranged from 1.1 to 17.4% change per year. The difference means that modeling studies report a lower percent change per year than the experimental studies. Also, the effect of fishing pressure was consistent over all traits.
What traits are most affected? The authors analyzed modeling and experimental studies separately. In the modeling studies, the analyses showed that the five trait groups could be distilled into two major classifications: (1) traits for reproduction and growth; and (2) size and age at maturity. Those traits involved in age of first reproduction (classification 2) were found to evolve faster.
The results of the experimental studies were more complex. Only one trait classification could be made by combining the size at maturity, growth, and reaction norm traits. Age at maturity was affected the most. Complicating the result, however, is that with increasing fishing pressure, the change in trait values differed based on the trait being evaluated. This means some trait values changed more for a given amount of fishing pressure compared to others. The rate of change fishing pressure induced in reproductive traits was greater than the rate of change of age at maturity.
Question three is for those of you who are really into math and statistical model design. For the fish folks here’s the take-away: two classifications were found in the modeling studies and one was slower than the other. But, increasing fishing pressure increased rates of evolution equally in both classifications. If you want to know more, read the pdf.
So, let’s put all this into perspective. Four major results jump out of this work. (1) Experimental studies report rates of change that are faster than those of modeling studies. (2) Increasing fishing pressure changed evolutionary rates equally in experimental and modeling studies. (3) Traits associated with maturation and the time it takes to become mature evolve at a faster rate than growth or reproductive investment traits. And lastly, even though each modeling study used different methodologies, they all more or less came out with equal estimates of the rates of fishery induced evolution.
But do we care? Should we care? Those are questions for you to answer, not me. The results showed that a single year of fishing can change a particular trait from 0.1% all the way to 17%. That is astonishing. We can quibble about precise rates, but that isn’t truly important. What is important is that simply by fishing we (humans) can induce rapid phenotypic change in the fish we capture. By maintaining fisheries for large mature individuals a younger age at maturity is being selected for. This makes good sense, as the fish that reproduce early have a higher chance of escaping the fishery and passing on their genes. Surely other factors can and are driving phenotypic change in the fish we catch, but this study demonstrates that fishing pressure can have a major impact on fish we value as a food source.
